There are two plotting generics for vinecop_dist objects.
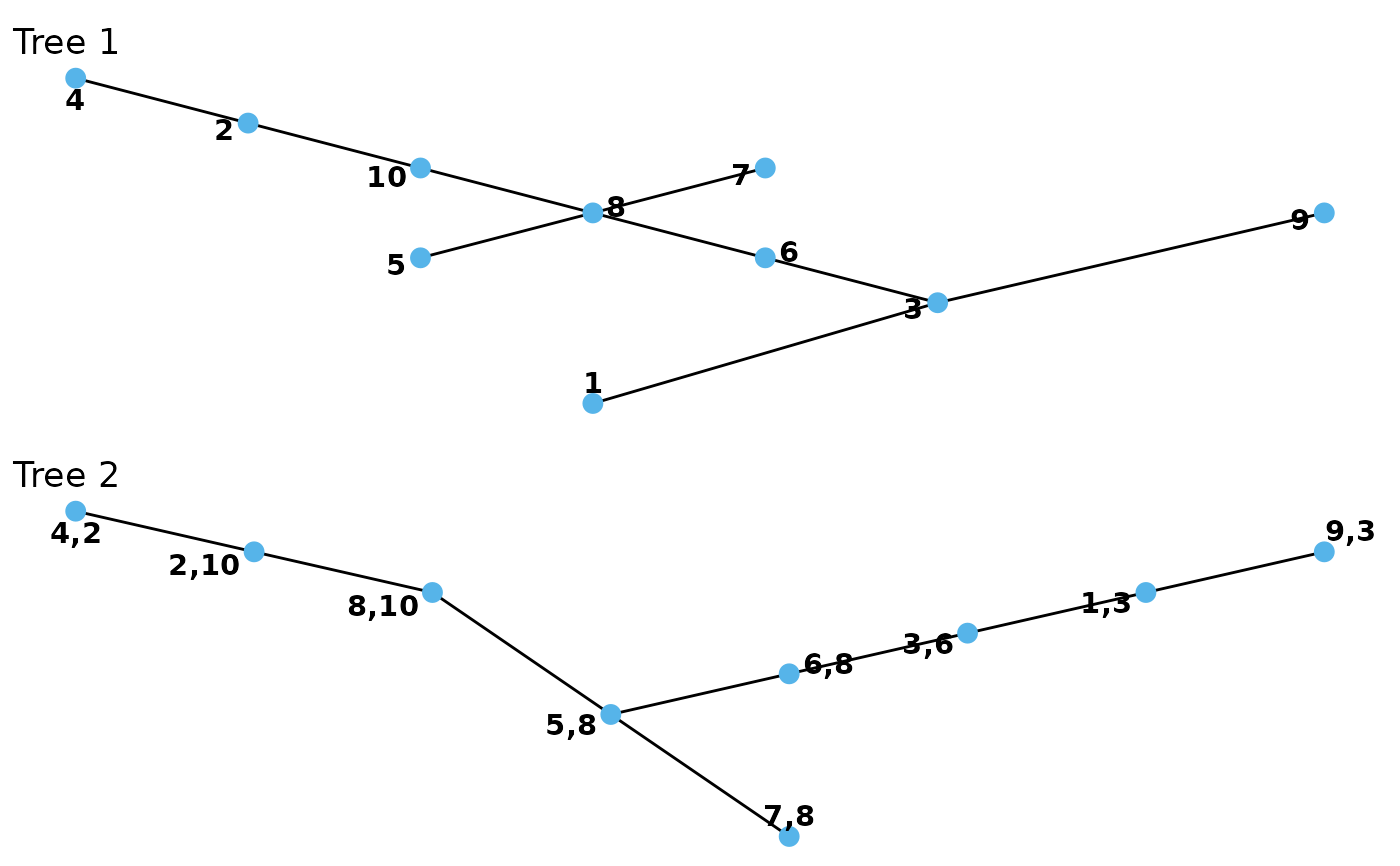
plot.vinecop_dist plots one or all trees of a given R-vine copula
model. Edges can be labeled with information about the corresponding
pair-copula. contour.vinecop_dist produces a matrix of contour plots
(using plot.bicop).
Usage
# S3 method for class 'vinecop_dist'
plot(x, tree = 1, var_names = "ignore", edge_labels = NULL, ...)

# S3 method for class 'vinecop'
plot(x, tree = 1, var_names = "ignore", edge_labels = NULL, ...)

# S3 method for class 'vinecop_dist'
contour(x, tree = "ALL", cex.nums = 1, ...)

# S3 method for class 'vinecop'
contour(x, tree = "ALL", cex.nums = 1, ...)
Arguments
- x
vinecop_distobject.- tree
"ALL"or integer vector; specifies which trees are plotted.- var_names
integer; specifies how to make use of variable names:
`"ignore"“ = variable names are ignored,
`"use"“ = variable names are used to annotate vertices,
`"legend"“ = uses numbers in plot and adds a legend for variable names,
`"hide"“ = no numbers or names, just the node.
- edge_labels
character; options are:
"family"= pair-copula family (see[bicop_dist()]),`"tau"“ = pair-copula Kendall's tau
`"family_tau"“ = pair-copula family and Kendall's tau,
`"pair"“ = the name of the involved variables.
- ...
Unused for
plotand passed tocontour.bicopforcontour.- cex.nums
numeric; expansion factor for font of the numbers.
Details
If you want the contour boxes to be perfect squares, the plot height should
be 1.25/length(tree)*(d - min(tree)) times the plot width.
The plot() method returns an object that (among other things) contains the
igraph representation of the graph; see Examples.
Examples
# set up vine copula model
u <- matrix(runif(20 * 10), 20, 10)
vc <- vinecop(u, family = "indep")

# plot
plot(vc, tree = c(1, 2))
#> Error in plot.vinecop(vc, tree = c(1, 2)): The 'ggraph' package must be installed to plot.
plot(vc, edge_labels = "pair")
#> Error in plot.vinecop(vc, edge_labels = "pair"): The 'ggraph' package must be installed to plot.

# extract igraph representation
plt <- plot(vc, edge_labels = "family_tau")
#> Error in plot.vinecop(vc, edge_labels = "family_tau"): The 'ggraph' package must be installed to plot.
igr_obj <- get("g", plt$plot_env)[[1]]
#> Error: object 'plt' not found
igr_obj  # print object
#> Error: object 'igr_obj' not found
igraph::E(igr_obj)$name  # extract edge labels
#> Error in loadNamespace(x): there is no package called ‘igraph’

# set up another vine copula model
pcs <- lapply(1:3, function(j) # pair-copulas in tree j
  lapply(runif(4 - j), function(cor) bicop_dist("gaussian", 0, cor)))
mat <- rvine_matrix_sim(4)
vc <- vinecop_dist(pcs, mat)

# contour plot
contour(vc)