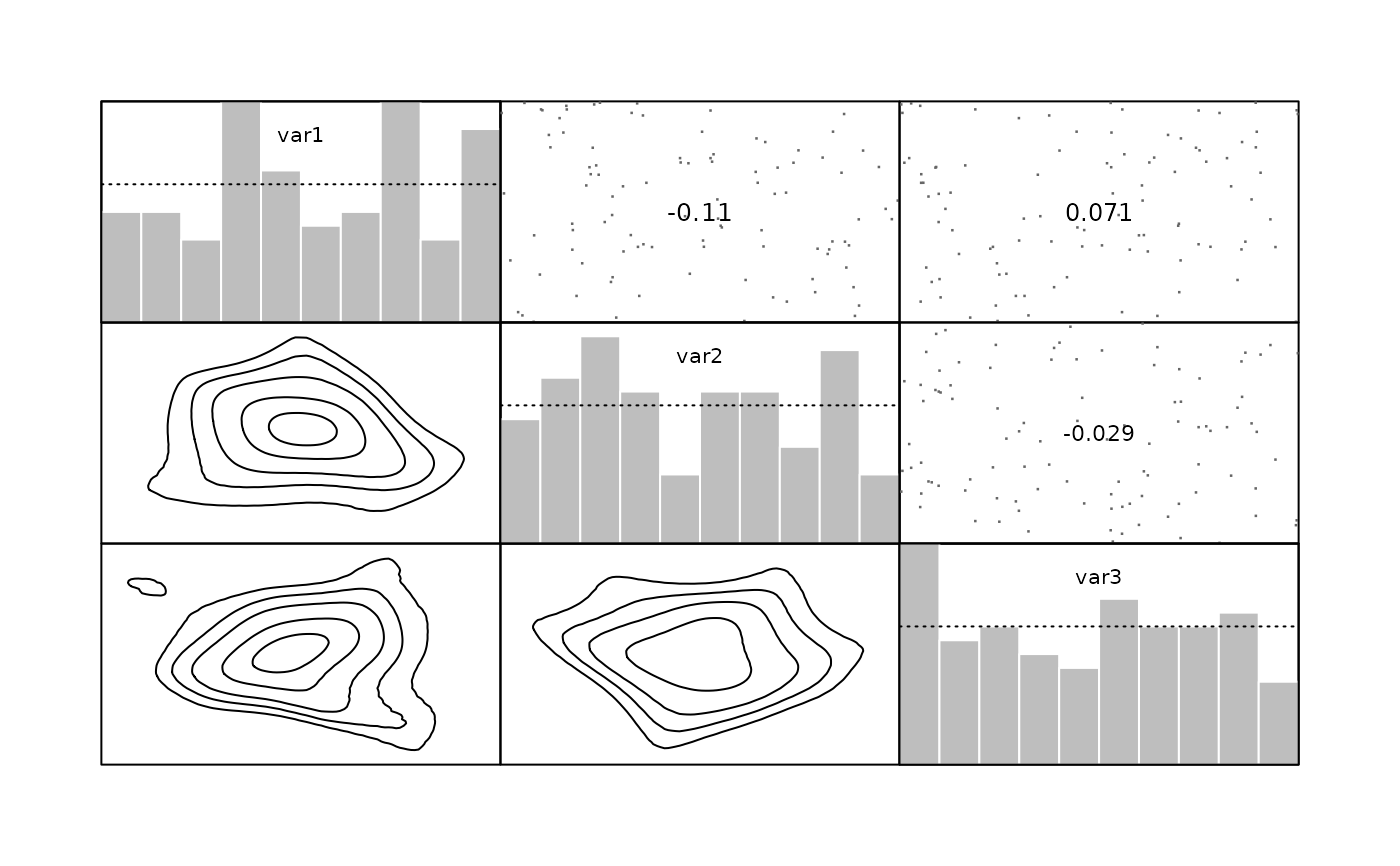
This function provides pair plots for copula data. It shows bivariate contour plots on the lower panel, scatter plots and correlations on the upper panel and histograms on the diagonal panel.
Arguments
- data
the data (must lie in the unit hypercube).
- main
an overall title for the plot.
- ...
other parameters passed to
pairs.default(),contour.bicop(),points.default(),hist.default(), orbicop().